I spent the last weekend participating in HackX, a hackathon hosted by the Cambridge Existential Risks Initiative with the goal of building a project to safeguard humanity from existential risks. It was the first hackathon I’d ever participated in, but fortunately my teammate Dron Hazra seemed to know what was going on and spoiler alert: we did quite well! The hackathon started at 11am on Saturday and we had until 2pm on Sunday to finish the project.
The Idea
There were a number of suggested categories for projects, from AI safety to nuclear war to pandemics. We decided, however, to go with the meta category and build a project that was applicable to all of these areas. The idea was based on the premise that in order to mitigate or prevent an existential risk, you need to be able to predict it. So, inspired by prediction markets like Metaculus and probabilistic modelling tools like Guesstimate, we decided to build a tool called Headlights to help train human intuition for predicting future events.
The main problem with prediction markets is that they have a long feedback loop. You make a prediction, and then you have to wait weeks or even months to see if you were right. This is a problem because it’s hard to improve your predictions quickly enough to be useful. To solve this, we decided to use historical data to allow users to make predictions and then immediately see how accurate they were. Headlights presents the user with a graph of some variable over the course of a decade or two, then asks them to give their 90% confidence interval for the value of that variable a couple of years after the end of the graph. I’ll talk about how the scoring system works a bit later, but in short, the user’s score is calculated based on how accurate their predictions were.
Of course, when making a real prediction in the present day, you don’t just take into account one variable over a short period of time. For this reason, Headlights also provides a search bar using which the user can search other datasets and newspaper articles from the same period. This gives vital historical context which allows the user to make more informed and realistic predictions.
This was our final presentation slide:
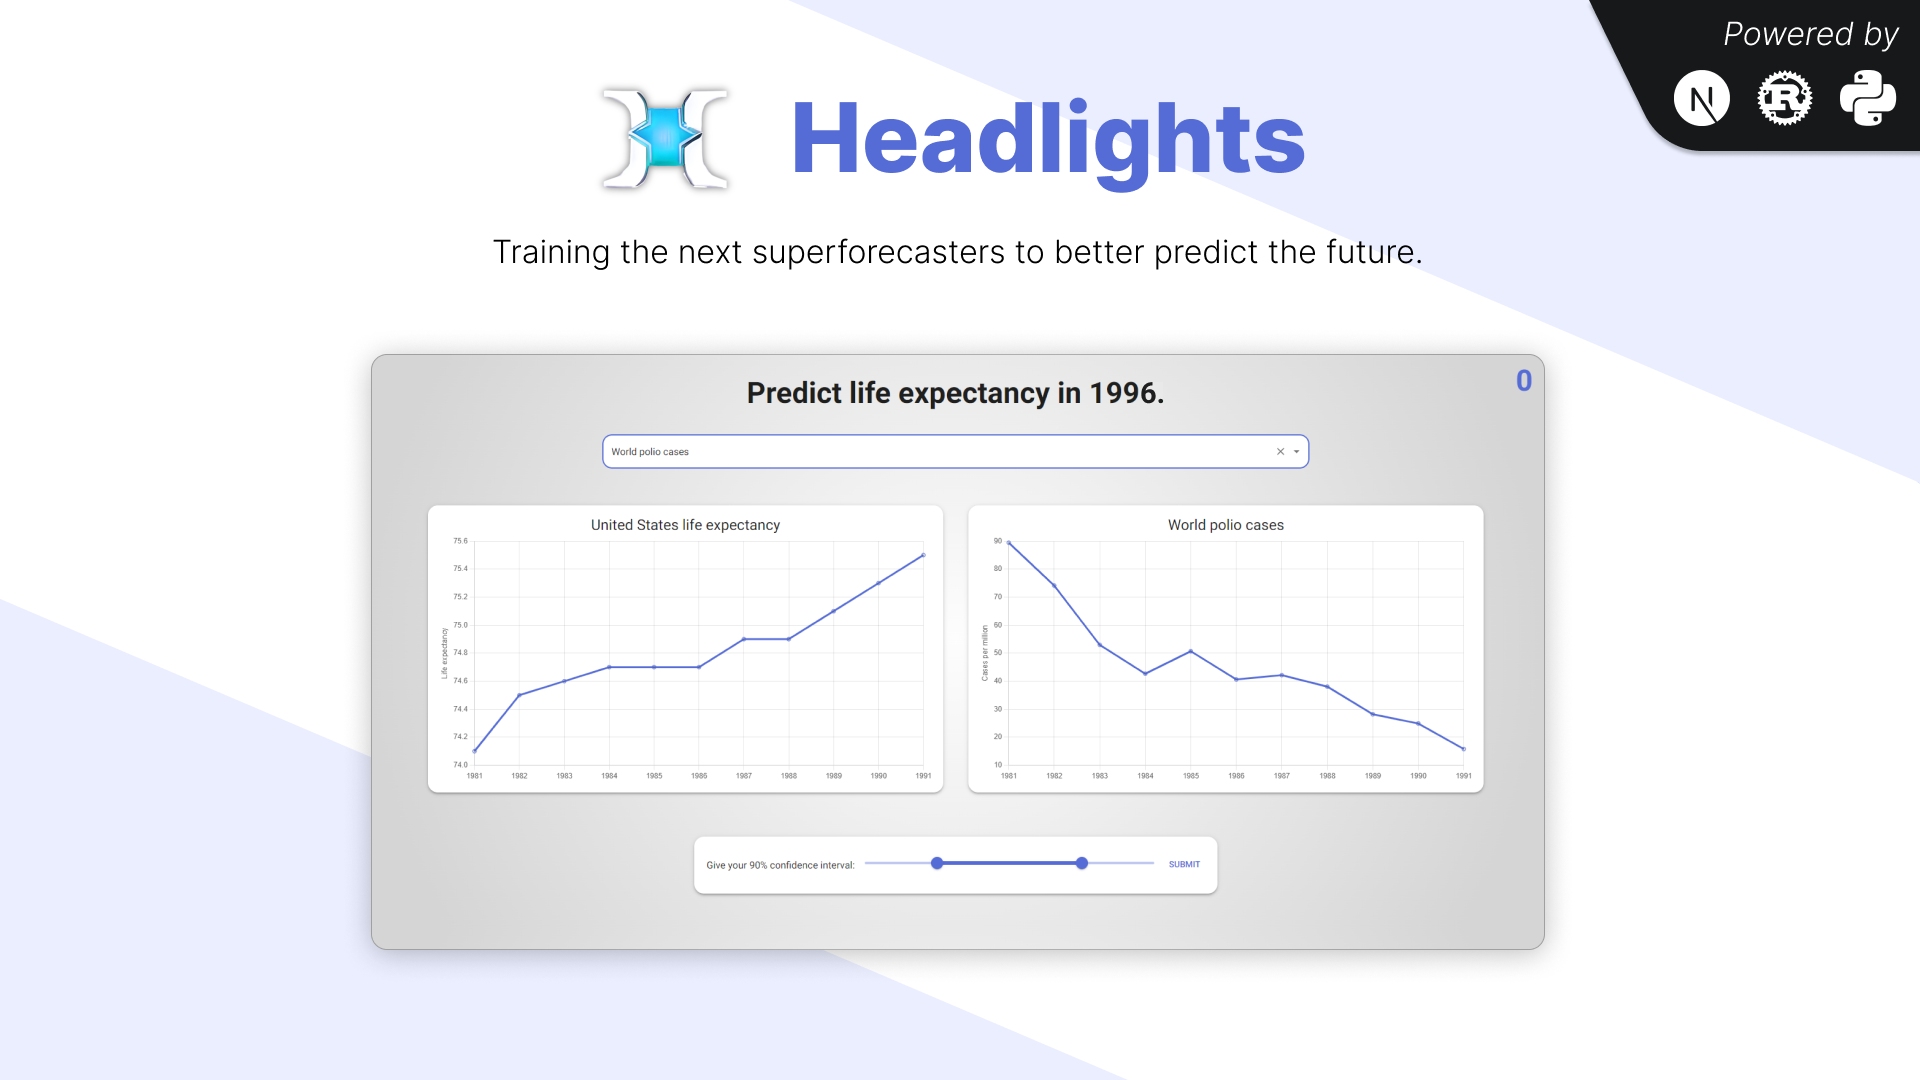
The graph on the left is of the variable the user is predicting (in this case, “United States life expectancy” from 1981 to 1991), and the graph on the right is of the variable the user is searching for (in this case, “World polio cases”) from the same period.
The Implementation
By around 1pm on Saturday, we’d come up with the idea and had a rough plan for how to implement it. Over free pizza, we discussed how to distribute the work and ended up with Dron on the front-end and me on the back-end, which worked out really well.
The final architecture is shown in the (somewhat unnecessarily overcomplicated) diagram below, and I’ll briefly explain each component.
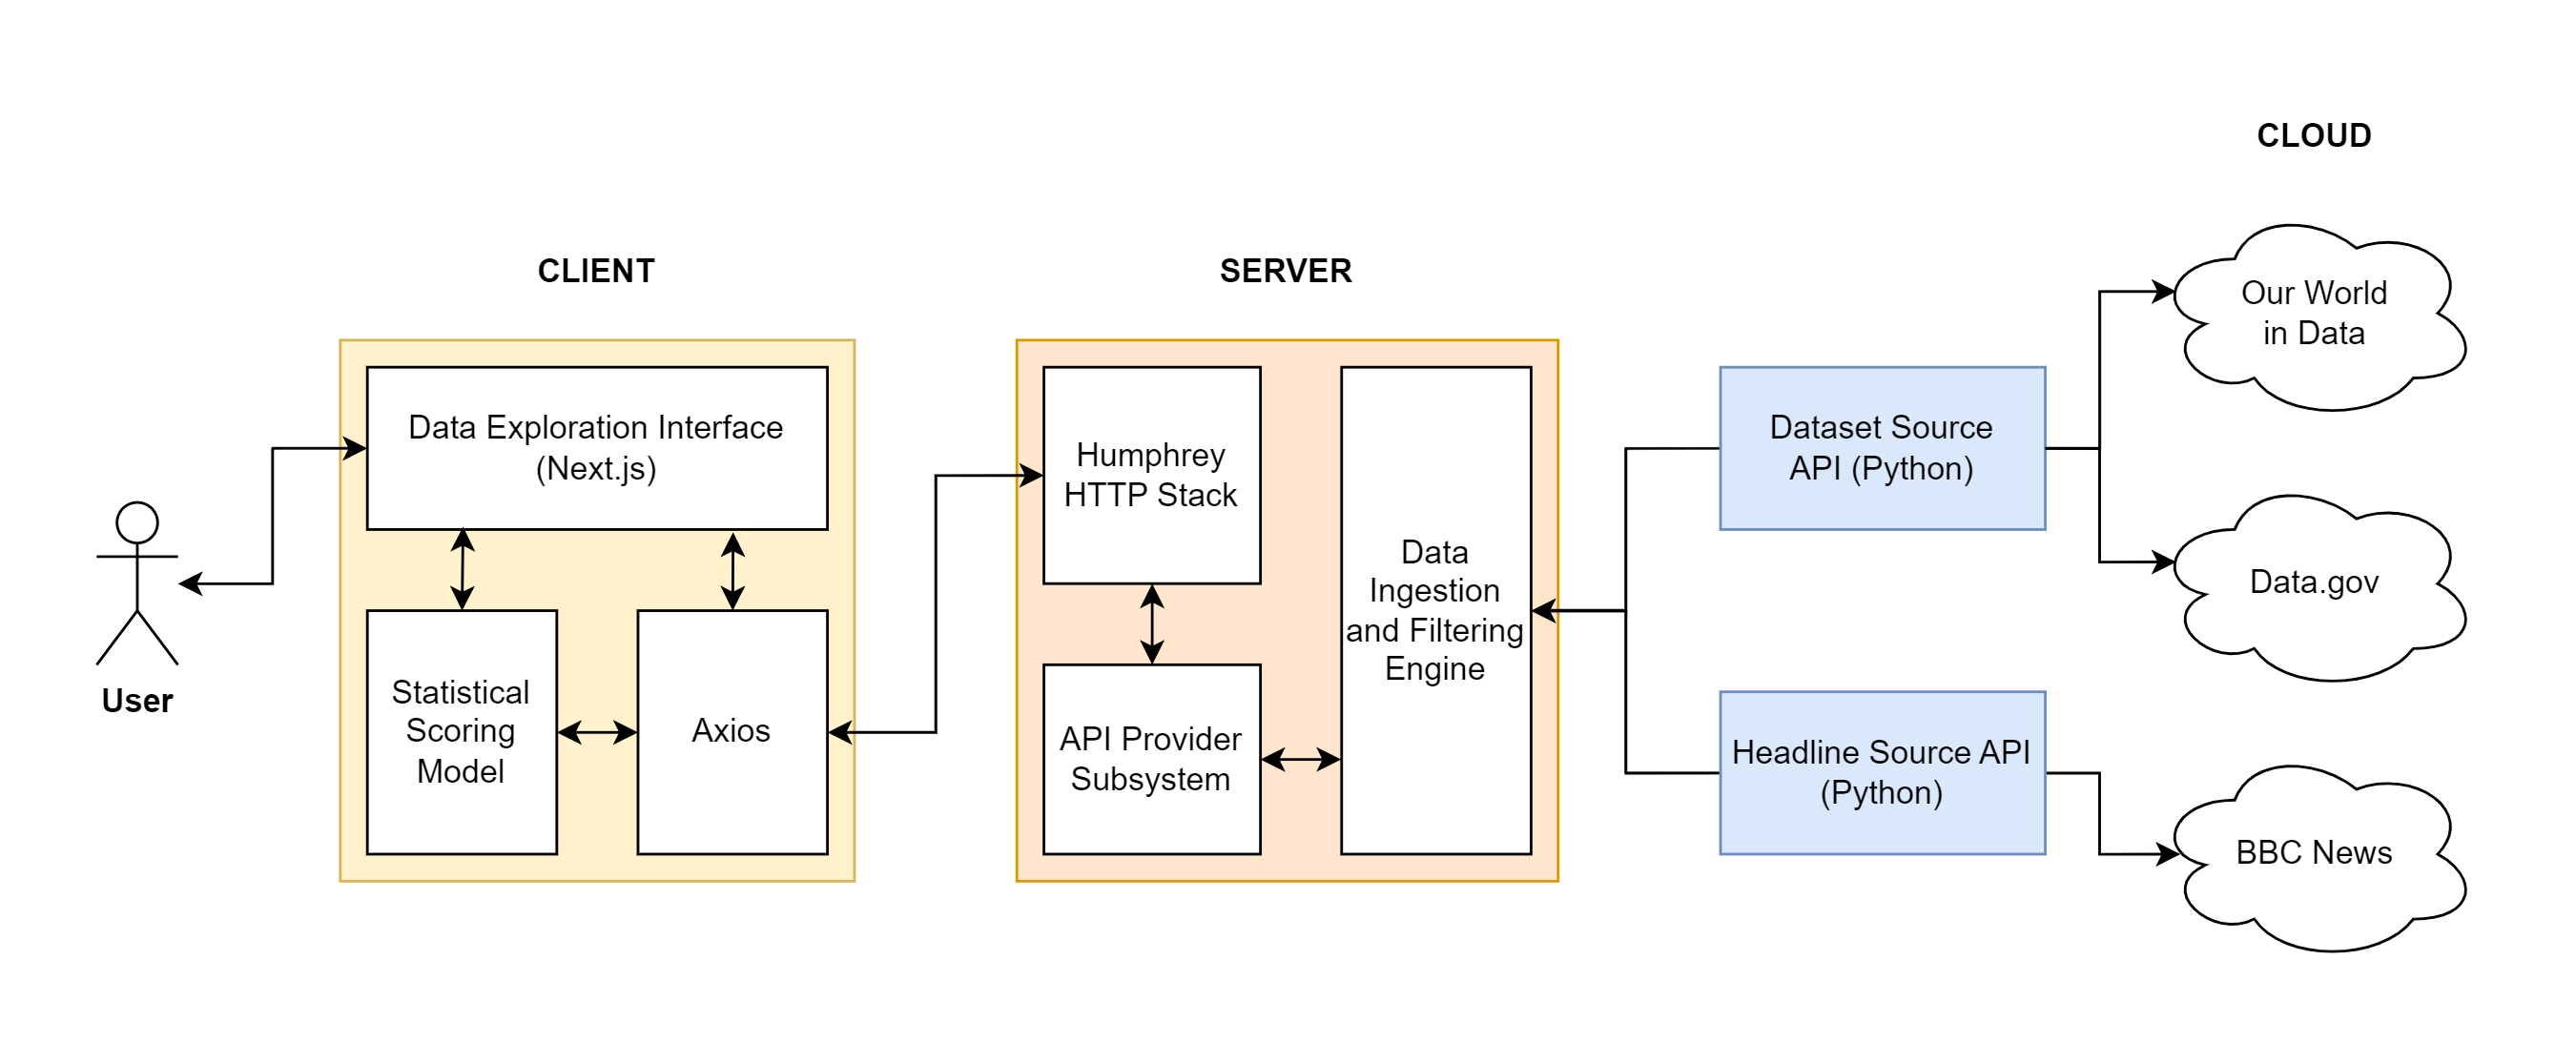
Getting the Data
At the core of the project is a huge collection of datasets and newspaper articles.
The datasets are taken from Our World in Data, a data aggregator that collects data from a variety of sources. After cloning the data repository, a Python script that I wrote parses the data and converts it to a standardised format. Each dataset becomes a directory containing a meta.json file and a data.csv file, containing metadata and the actual CSV data respectively. In the future, the script could be easily adapted to pull data from other sources, such as Data.gov.
The newspaper articles are taken from the BBC’s On This Day archive, which was put together in 2007 and seems not to have been updated since. It contains nearly 2000 articles about the most important world events since 1950. Another Python script uses the Beautiful Soup library to scrape the archive and extract the articles, which are then categorised by date and stored in a JSON file.
Serving the Data
The server loads the data from the CSV and JSON files and serves it to the client through an HTTP API. The API is implemented using my own Humphrey web framework, and it provides endpoints for getting a series of data points, getting a specific data point, searching for articles and datasets, and randomly selecting a dataset to predict. The data, if it fits, is fully loaded into memory to speed up searches and queries. Being written in Rust, the server is very fast, and can search through and filter more than 600,000 datasets and articles in under a second.
The Front-End
The front-end provides the data exploration interface, written using Next.js and React. It communicates with the server using Axios and displays the data using Chart.js. The front-end is also responsible for the scoring system, which I’ll talk about now.
The Scoring System
As I mentioned earlier, the user’s score is calculated based on the accuracy of their predictions in a process called “calibration”.
Calibration measures the validity of probability assessments. It is a measure of how well a user’s predictions match the actual outcomes. It would be unreasonable and unrealistic to ask the user for an exact value, so instead the user is asked to provide a range of values corresponding to their 90% confidence interval. The user’s score is then calculated based on how often the outcome falls within their predictions.
If 90% of the user’s predictions are correct, then the user is said to be calibrated and this gives them the greatest possible score. If the user gets more right than this, then they are underconfident, which means that their intervals are too wide and hence their score is reduced. Conversely, if the user gets less right than this, then they are overconfident, which means that their intervals are too narrow and likewise they are penalised.
Dron found a very useful paper about this concept, but this was at nearly 2am on Sunday so we had a fair bit of trouble figuring out a mathematical function to implement this. After a long time messing around on Desmos with exponential and logarithmic functions, we finally realised that the solution is far simpler: just use a binomial distribution with a probability of 0.9, then normalise the result to be between 0 and 1.
The scoring function we ended up using is given by:
where is the number of correct predictions in predictions. This function is analogous to the binomial distribution, normalised such that the maximum score is 1.
After figuring this out, our first prototype was complete so we called it a night and went to sleep.
The Issues
The key issue with this idea is that using historical data may introduce bias. For example, if the user is given life expectancy data from 1903 to 1913, and asked to predict the life expectancy in 1918, then their prediction will likely be influenced by prior knowledge about the First World War. This problem can be mitigated by using a large number of varied datasets from around the world, in the hope that the user’s general historical knowledge will not be broad enough to make a significant contribution to their predictions.
Another issue is whether this sort of thing even works at all! It’s not at all certain that people can actually improve their predictions using such a tool. This is something that would require actual research to find out, which is impossible to do in 24 hours, but it would be an interesting thing to look into.
Conclusion
By around 2pm on Sunday, we had the bulk of the project complete and somewhat polished just in time for the judging to begin. Three judges came around and asked us a few questions about the project, and they seemed quite interested in it. I had an online supervision at 3pm, so I left Dron to present the project to the last judge by himself while I tried to concentrate on my work - fortunately the supervision was on one of the easier topics so it went quite well!
At 4:30pm, the judging had concluded and the winners were announced in the closing ceremony. We were very pleased and surprised to find out that we came first in technical skill and third overall! As well as the much-coveted HackX t-shirt, we also won £840 of prize money to split between us which was amazing.
I had a great time at HackX and I’m really glad that I decided to go. While I did leave exhausted and very behind on my work, it was absolutely worth it and I hope to go to more hackathons in the future. Thank you for reading this post, and if you’re interested, you can find all the code for Headlights on GitHub.